Calculation of the microwave transceiver module paths
Using microwave signals it is extremely important to harmonize transmitting and receiving microstrip paths of modules made on printed circuit boards. In particular it concerns ultra-short pulse (USP) signals with the duration of split nanosecond, when it is necessary as much as possible to keep undistorted the waveform pulse propagation.
On the basis of the expert-analytical system (EAS) "MSR-Impulse" was improved the harmonization of transmitter-receiver paths of impulse-based ultra-wideband module “PicoR” series. Most notably, a mathematical model of the product as a whole was created in the Computer-Aided Design (CAD) of electrodynamic modeling to identify negative influences of elements and calculate of line-building-out network of radar module paths.
Creation of mathematical model demands authentic measurements of a matrix S-parameters for taking into account impedance of circuits of generator and receiver which in turn demands measurement of parameters of a circuit in close proximity to output connectors of these components.
Researches of characteristics of a receive path. To obtain a complete picture of characteristics of the path harmonization it is necessary to carry out measurements with power-on of the receiver cascades and with power-off. Thus the key information parameter for quality evaluation of circuit harmonization is index of the standing wave ratio (SWR) in the tract or reflectance factor.
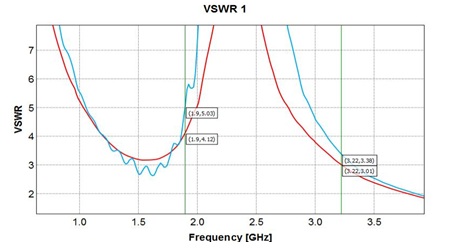
For measuring SWR 1 module was connected to vector network analyzer, which was calibrated before that. The picture below indicates a graph of SWR as a function of frequency for reception path module 1. Green shows a graph of the VSWR for a module with power off, red shows a graph of the SWR for a module with power off.
As you can see from the picture, the indexes of VSWR when power supply is switch on or switch off are differing. The input path executed in the form of the microstrip line of a certain width on the four-layer glass epoxy FR4. The index of the VSWR equal 2.0 chart crosses only 3.65 GHz frequency, corresponding to a loss of the most part of the intake energy on rereflection in the receiving path.
For performance enhancing harmonization in the CAD system the path was recalculated with changing of a form and sizes of the strip line. The next figure indicates a graph of the VSWR as a function of frequency for reception path module 2. Blue shows a graph of the VSWR for a module with power off, red shows a graph of the VSWR for a module with powered on.
Stepping down the impedance of an active part of microstrip line it was possible to reduce index of VSWR up to 3.0 in frequency range between1 to 2 GHz. However, in frequency range above 3.0 GHz the VSWR graph has not changed in principle. It is also worth to note that the difference between the graphs of VSWR while receiver’s .power supply was switched on and switched off is negligeable.

